Introduction
Most of the diversity of life on our planet comes from microbes. They can thrive in many environments throughout the biosphere and have been around for billions of years. During the 1880s, Sergei Winogradsky developed a method for culturing a large diversity of microorganisms. He did this by placing pond mud and water into a column with a carbon and sulfur source to create an observable environment.These contraptions, called "Winogradsky Columns," allow for the creation of microbial mats, which are multi-layered sheets of microorganisms composed mostly of bacteria and archaea. We used this method to test the effects of different salinities on the growth of these microbial mats and the diversity of the microorganisms found within them. Our sample was taken from a fresh water source, therefore it is unlikely that there will be many halotolerant bacteria. With that in mind, we predict that as the salinity increases, the diversity of microbial growth will decrease.
Background
Winogradsky Columns are representations of the natural phenomenon of the development of microbial mats. Communities of microbes allowed to grow without predation tend to stratify based on metabolic and tolerance needs. Communities usually involve organisms that require access to oxygen and light and those with resistance to ultraviolet radiation growing in zones closer to the surface with exposure to those factors, while communities buried lower down have access to byproducts from the decay of organic material and thrive in the euxinic atmosphere.By combining natural sediment and water in a glass jar and allowing it to incubate for an extended time, a Winogradsky Column is expected to stratify independent of further laboratory manipulation. Here, we gathered samples of sediment and pond water from the WSU duck pond and built columns containing increasing concentrations of salt (NaCl) in an effort to understand how the zonation of the Winogradsky Column would be influenced as the microbial communities from the duck pond are cultivated in the varying ionic concentrations and osmotic conditions.
Hypothesis + Experimental Design
We hypothesized that adding salt to our Winogradsky columns would decrease the amount of diversity present in the columns, and that this would be visible in the number of layers each column formed.In order to test this hypothesis, we set up our experiment so that each column has a different amount of added salt in the water. The concentrations we decided to test were 0%, 4%, 8%, and 12% salt. Other than the salt concentration, the columns were as near to identical as we could make them. The soil and water were gathered from the same location in the Weber duck pond and homogenized before being added to the columns, and the same amount was added to each column (soil up to 12.6 cm, water up to 18.6 cm). In addition, we added a whole egg to the bottom of each column and mashed them thoroughly with spoons to provide additional carbonate and sulfur to the column. Finally, we wrapped the outside of the column with garbage bags to block light from the sides and promote the formation of clear layers, and placed the columns in the window sill of the lab to incubate.
Variables & Controls
- The variable in our experimental design is based on changing the salinity of the water in the columns. This is done to view the effects of salt concentration on microbial mat growth.
- Our control column was set up using water from the same source that did not have any salt added. We did this to observe the natural growth of the microbial mats.
Field Sampling & Measurements
Field Protocol
The field plan included collecting soil and water samples from the campus to construct the columns. The samples were taken from the Weber State University duck pond and surrounding landscape.The water sample was collected by dipping a small bucket into the North East section of the pond; an area near the fountain that is fairly free of algae growth and debris. A soil sample was taken from the nearby landscaped island to the south using a spade by turning the grass aside and gathering fresh soil. A small bucket was used for transport of the soil sample. The water was tested for salinity content using a refractometer. A clean dropper was used to dispense two drops of the pond water onto the refractometer. The temperatures of the water and soil were measured using a laser temperature gun. Ambient temperature was also measured with the laser temperature gun and verified using web based weather data for Ogden, Utah.Field Measurements
Air Temp: 31.0 °CWater Temp: 20.8 °C
Weather: Sunny and warm, not very windy. Very few clouds in the sky.
Location: Weber State Duck Pond; Latitude: 41.1927 Longitude: -111.9464
Time: 2:48 PM
Date: September 7th, 2018
Salinity of pond: 0%
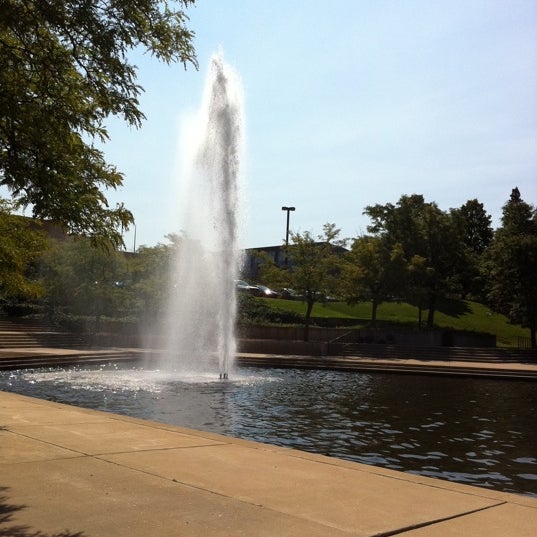 |
| Figure 1: Weber State University Duck Pond, the source of the water for the Winogradsky Column experiments. |
Procedure for the Winogradsky Columns
- Place 1 chicken egg in each of the four glass columns and smash egg up with a cooking spoon.
- Measure 12.6 cm from the bottom (about 80% of 18.6 cm column) of each glass column and mark with a permanent marker.
- With another cooking spoon, scoop soil from environmental sample and fill each column to previously marked line, 12.6 cm. Pull out any large grass and roots when possible and compact the dirt as you go.
- In 1000 ml graduated cylinder measure out 340 mls of pond water.
- Add the 340 mls of pond water to first column and label as your control.
- Using three separate 1000 ml graduated cylinders, measure out 500 mls of pond water for each of the remaining three columns.
- In the first 500 ml pond water sample add 20 grams of NaCl to make a 4% salt concentration solution. Stir solution until salt is completely dissolved.
- In the second 500 ml pond water sample add 40 grams of NaCl to make an 8% salt concentration solution. Stir solution until salt is completely dissolved.
- In the third 500 ml pond water sample add 60 grams of NaCl to make a 12% salt concentration solution. Stir solution until salt is completely dissolved.
- For each separate salt concentration, measure 340 mls of solution and pour into one of the three remaining columns. Label columns according to salt concentration.
- Use spoon to mix water, soil and egg.
- Cover top of each column with clear plastic wrap
- Put all four columns in a window with labels facing away from the window.


