Friday, November 30, 2018

World's Hottest Microbe ;)


Hey Hey! I things a little hot! So if you’re on board with spicy food, hot yoga, a fiery personality and sizzling adventures in crazy hot places then I’m your girl. Come visit me, in the pacific northwest at the bottom of the ocean inside my own personal sauna home, a hydrothermal vent. Not to toot my own horn but I have revolutionary metabolism, so you’ll never have to worry about me getting out of shape. I also was nominated as the world’s hottest microbe, so you could say I got some good genetics. I’m currently preoccupying myself working with scientists researching ways to use organics and turn them into electricity based off my metabolism mechanisms. Because of that I don’t have much time for friends but really there aren’t a ton in my remote sauna area. If we can figure out better ways to utilize this cool personality trait I have, I could totally help change the world as we know it, which is my life’s goal. I’m really looking for someone that not only can take the heat but is motivated and busy with their own work (preferably In STEM careers because that’s what I’m involved in and it will be easier to relate). Also hoping to find someone that is passionate about my life goals because they are priorities I’m not ready to give up.
-Strain 121


Epigenetics, genetic mutation and carbon cycle effect on climate.

In the article Marine microbes:Small but might at capturing carbon by Devi Lockwood, researchers are attempting to better understand the mechanism and timescale of marine microbe evolution. The question: where do shifts in microbial dynamics feedback on climate dynamics? We know tiny shifts in the environment of these microbes can cause genetic mutations or epigenetic changes. What this group of researchers attempted to do was understand more fully the timescale of these types of changes. What they found was that the initial variability in fitness for a new environment is driven by epigenetic change, which is heritable but also reversible. Not only are epigenetics a result of the intital variability but also a result of frequent environmental fluctuations. In contrast, a sweep result induces genetic mutations which fix the microbial population. This phenomena was observed when organisms were introduced to new environments at longer interval lengths.

Why is this relevant? Well small changes in the types of organisms that populate the surface of the ocean can be magnified and impact the whole marine food chain. Additionally, these microbes drive marine carbon cycling which regulates the climate in respect to how much CO2 is dissolved in the planets oceans. Developing a better understanding of the timeline associated with these genetic changes can help us avoid catastrophe in our marine ecosystem as well as our climate.

-Maya

Flash Back on Cyano Progress on 10/26/2018


A little late posting my observation notes from October 26th but better late than never. Our hypothesis for this experiment was we would see less stratification as a result of increasing salt concentrations. That hypothesis still rings true with what I observed.

As pictured in Image A, the top couple centimeters of the top are strictly water, until of course you reach the sediment build up that characterizes the rest of the column. The amount of growth in these top water column areas is very telling. The color of the water in the 12% salinity column is lighter than the 8% and considerably clearer than the 4% which was brown. The control top water column was bright green indicating strong cyanobacteria growth. The clearer water in 12% and 8% indicate little to no growth in these sections despite proper light, water and nutrient exposure. Thus, supporting our hypothesis that we will see fewer organisms in higher salt concentration columns.

Additionally, I observed that the control column had the most stratification (based on color or obvious lines) with five distinct layers. On the other hand, 4% salinity had four stratification layers; 8% and 12% had three layers (Image B, C and D) . This also support the hypothesis that the higher the salt concentration the fewer the organisms capable of growing in that environment.

Other observations to note- In the control, the side facing the window had very bright green cyano growth through most of the column (Image E). The other three columns didn't show significant differences between the side of the column facing light and the one not facing the light. The first stratification layers (counting from top to bottom) for all four columns started at or above 9 cm from the bottom. More specifically, the first stratification layer for the control and 4% salinity were both right around 9 cm. The first stratification for 8% and 12% were both at 11.5 cm.

To conclude, our columns so far are supporting our hypothesis and showing small increased amounts of growth each week.

Maya

Image A. All four columns from left to right- control, 4%, 8%, and 12% salinity. Top stratification layer shows distinct differences in color with 12% showing the lightest water column. This indicates the smallest amount of growth. 

Image B. 4% salinity column showing 4 stratification layers. The side pictured faces away from the window/light. 


Image C. 8% salinity column showing 3 layers of stratification. The side pictured faces away from the window/light. 


Image D. 12% salinity column showing three layers of stratification and a light top layer of water. The side pictured faces away from the window/light. 

Image E. Picture of the light facing half of the control column showing strong cyanobacteria growth. 


11/26 Winogradsky Column update:

The control column is showing a lot more variability in its color and layering. These results confirm our hypothesis from the beginning of this experiment, which was adding more salt will decrease the growth of the organisms, resulting is less color variability. In the salty concentrations, there is almost no band formation and the coloration is the same throughout. Another thing that I noticed looking at our salty columns is that the water level seems to decrease with increasing salinity. Not only has the water level decreased, it has also settled on top of the sediment, making it more difficult for any of the bacteria lower in the column to get the water they need. This could be a major cause of less growth in these columns. Finally, the coloration at the top of the columns are different as the salinity increases. There is a lot of green at the top of the control column and more reddish orange coloration in the higher salt columns. What this shows is that the cyanobacteria are highly affected by the addition of the salt and that the type of cyanobacteria in the column will vary based on salt concentration.

-Courtney

Left to right: Control, 4% Salinity, 8% Salinity, and 12% Salinity 


Left to right: 4% Salinity, 12% Salinity, 8% Salinity, Control 


Order is the same as picture above.


How are our Winograddsky columns doing?

GeoMicro 3753Fall 2018 Winogradsky Columns

        Well, It has been 12 weeks or so since the creation of our mad experiment. We took a bit o' duck pond water, some soil stolen, umm, acquired from nearby and added a dash of sodium chlorite (that's salt; just sayin') in varying concentrations...threw in an egg to grow on... and we were off! Once in a while over the term, somebody would check in on our growing microbial high rises, take some candid photos and give us all on ongoing status update here at the Weber Geo Micro blog.
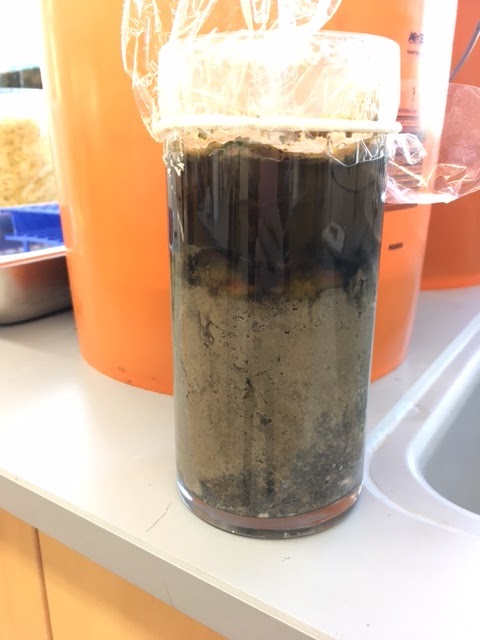
         As a budding Geologist, I must admit that growing microbes in soil wasn't of much interest; however, the results are quite amazing. You notice above, we have several columns. Each column represents a percentage of sodium (there's that salt again!). Can you guess which one has no salt added to our "fresh' water and soil? (Hint: it's the one on the left with no percentage marked on it.) I am really impressed with the stratifying colors. The layers are different types of microbes, bacteria, living at on the different 'floors" of the microbe high rise. This shows how different needs can be served for different species of bacteria: ya know, like the access to oxygen, the egg nutrients (carbon and sulfur), how much sunlight they get etc. 

Here's a look at the tops of the columns, the penthouse suite of the high rise! Do you see all that nice frothy growth? It seems as though the high salt content of our 12% column isn't as much of a party as the totally fresh column. Back to the stratification (layering);


 Wow! The control column; that means no salt added, is really growing some layers! This a view of the room side; away from the direct sunlight. We have some nice greens, black and even a bit of yellow and white. I wonder what the sunlight side looks like?


Wow again! With the direct sunlight, the layers are very thick and penetrate the soil almost to the bottom. Down there near the egg at the bottom will be the yummy sulfur that some of the bacteria like to eat. Some times ground floor of the high rise is a party too! Let's take a look at the poor 12% saline column, shall we?


Hmm, not as exciting at all. This is the sunlight side and you can tell right away that there just isn't as much going on. The layers are very thin, except that top grey brown milky looking stuff. There is a nice black layer but once again, very thin and not penetrating the soil. It would seem that microbial community that lives in the duck pond is not to fond of salt. But also interesting is that something is growing and surviving...on little oxygen and far away from the yummy egg in the soil. even in adverse conditions, the microbial world finds a way to live. Of course, the real party is going on in the control column.

Looking back at the top photo, you can see that a rich community grows in each column until you get to the 12% saline. Granted; the diversity and richness declines at each level (4% and 8% if you were wondering). It would seem that the original question of "does the saline concentration have an effect upon the growth of bacteria in fresh water from the pond?" is answered with a resounding YES!

My scope of interpretation on what each of the layers means in term of what bacteria are growing is limited and the attention span is slim. I can reveal to you that each layer, as mentioned above, represents a particular microbe with particular needs. Some seek the sun and available oxygen, others seek the dark depths of the soil, looking for the sulfur and carbon of the egg. Some of the microbes follow the others, feeding off of the by-products of their neighbors and in their turn feeding yet other microbes. I leave the technical aspects of this experiment to my microbiologist colleagues. I am confident that in the future as I learn more about how the smallest things (microbes) affect our planet, I will remember this experiment. So I leave you, dear reader with this...Life is rich and persistent but even small changes to the conditions of that life can have profound effects. As demonstrated by the higher saline content, even adverse conditions will yield some results.

Steve Moore
Applied Environmental Geoscience
Geosciences Department


Sunday, November 25, 2018

Winogradsky Column Update 11/9

The columns are beginning to show some separation in the stratification levels. The biggest changes being in our control column. This control had no salinity added to it,which begs the question, can the salt have that much of an impact on an ecosystem? In the control we have growth on top of the water, in the water, and under the water. This is classic stratification as seen in the wild. If I were Steve Irwin, I would definitely proclaim this sample, "She's a Beaut!"

We then start to move up the salinity scale and things start to change. In the 4% salinity column, stratification begins to disappear... There is no longer the green top growth and the water changes to a mucky brown color. This could show that the addition of salinity, changes the growth patterns and the wavelength of light used for organisms to grow. At 8%, the water begins to clear and a firm black/brown color begins to develop between the aquatic layer and the sediment. This growth still uses light but not much it seems... We finally arrive at the 12% salinity, we still have that dark brown/ black color of organisms under the aquatic layer but its minimal. It seems we have extremely limited the growth nutrients but as always... Life finds a way.

-Thomas

P.S. Check out the observation as seen through my eyes below!

Figure 1.1 - Control Column (No Salinity)
Figure 1.2 - 4% Salinity Column 
Figure 1.3 - 8% Salinity Column
Figure 1.4 - 12% Salinity Column
Figure 1.5 - The whole gang with their favorite view

As Earth Warms, the Diseases That May Lie within Permafrost Become a Bigger Worry

In this article from Scientific American, the authors discuss that global warming leading to melting of permafrost may result in the release of ancient bacteria that have been trapped frozen in the permafrost. This arises great concern as it is likely that humans will not have sufficient immunity against these infectious agents. They used a case of anthrax on Yamal Peninsula in Siberia as an example. The thawing of permafrost released spores of Bacillus anthracis which were previously immobile, releasing them into water and soil contaminating their food supply. This resulted in the deaths of 2,300 reindeer, 100 people where hospitalized 20 with potentially deadly infections, and the death of a 12 year old boy.

Of course not all organisms can survive in the extreme cold aside from viruses and organisms which can form spores or enter other dormant states allowing them to survive for many years. Current research and analysis, such as DNA sequencing and protein analysis, is being done on permafrost to uncover the properties that these potentially threatening unknown organisms, called microbial dark matter, may possess.

Some researchers argue that the thawing of permafrost is not the most urgent concern that we face. They reference other research that has shown an increase in the range of certain illnesses, dengue and malaria, spread by mosquitoes as the earths surface warms. Their closing statement addresses a way to prevent these events from occurring. Lowering fossil-fuel consumption to slow climate change is their solution to both threats that have been discussed.


Week 9 - November 16th

November 16th observations
Josie Wood

From my observations I found that there was more diversity in stratification in the control and 4% salinity columns. From this, it is clear that an increase in salinity can affect what organisms are able to grow. I also found that that there was more stratified layers and colors on the side of the column that is facing the window at all times (see table 1).
For the control column the bottom layer appears to just be sediment, but the thickness of this layer differs depending on if it was on the light or dark side (6.5 cm vs. 9.1 cm respectively). The dark red-brown band is most likely anaerobic bacteria, however on the light side this band is thicker and specked with light green, possibly anoxygenic photosynthetic bacteria. Darker green bands on both dark and light sides are most likely communities of cyanobacteria and nonsulfur bacteria. The green water most likely contains both diatoms and cyanobacteria.
The 4% salinity column contains less stratification than seen in the control column. Again, the sediment is occupying the bottom 9.2-9.7 cm of the column. The dark side of the column then has a 1.2 cm band of dark green, most likely cyanobacteria, and then the water. The light side has a yellow band with pink spots between the sediment and the green band of cyanobacteria. This yellow/pink band may contain purple and nonsulfur photosynthetic bacteria.  
Both the 8% and 12% salinity columns had less stratification and did not show any changes between the dark and light sides. For both these columns the sediment occupies most of the space with a thin layer of dark green/black at the top of the sediment and then the water. These observations are similar to those that were made on week 8 although the green/black layer seems to be slowly gaining thickness. Approximately .2 cm to .7 cm in 8% salinity and from less than .1 cm to approximately .1 cm in the 12% salinity column.  


Figure 1. Control (left = dark side, right = light side)

Figure 2. 4% salinity (left = dark side, right = light side)

Figure 3. 8% salinity

Figure 4. 12% salinity


Figure 5. Top view (control on left with increasing salinity to the right)


Table 1. Recorded observations and band widths taken on Nov 16th. Columns with 8% and 12% salinity did not exhibit any differences between the light and dark sides.

Wednesday, November 21, 2018

Antarctic Sea Ice May Be A Source of Mercury in Southern Ocean Fish and Birds

Antarctic Sea Ice May Be A Source of Mercury in Southern Ocean Fish and Birds
Written by Caitlin m. Gionfiddo, Michael T. Tate, Ryan R. Wick and others
Link to article

This article describes that sea-ice bacteria are able to change mercury into methylmercury, which is more toxic and contaminates marine environments. The study was done in Australia and the findings were published in the Nature Microbiology journal. The methylmercury can travel to the brain and cause developmental issues in infants and children. Humans are effected by this because the larger fish that we consume will eat the smaller fish that has been contaminated. Researchers are saying that with this new finding it is even more important that we limit mercury pollution as well as consumption of certain kinds of fish. They are also saying that as global warming increases, the fish populations will deplete and people may look for seafood more in the southern regions where this is issue is occurring.

Sunday, November 11, 2018

Psychrophile Dating Profile

If you like long walks on the beach, keep on scrolling. The colder, the better! Extravagant ski trips in Antarctica is something you could expect with me as well as trips deep into the ocean. (I bet your mesophilic dates couldn't do that). I live in places that most don't, so I enjoy meeting new people. That being said, if you can't handle my lifestyle, its not going to work out. My living situation is pretty specific and I won't change for anyone! I have pretty similar characteristics of other microbes out there, I'm just way more interesting and tough. Basically you can always count on stealing my jackets and hoodies since I won't need them anyway (I know girls seem to really dig that).

psychrophile

I don't have a lot of pictures of myself, selfies aren't really my thing.

Saturday, November 10, 2018

Piezophile Dating Profile

Piezophile Dating Profile

Hi! You could say that I’m under a lot of pressure. Literal pressure from the ocean and pressure from my family to bring someone to Thanksgiving dinner this year.. so now that THAT’S out of the way, I really am really cool. Like really cool—often extremely cold, so I need someone to warm me up. The reason I think I’m still single is that I’m so far away from everyone fun! But long-distance relationships can be fun, right? 😉 A fun fact about me is that I speak a little Greek. Well, I only know one word: piezo which means pressure. Even though I’m not fluent it’s OK—that one word is in my name so it’s still cool. I don’t see a lot of sunlight, so I’d love for a partner to take me on an adventure! Even though there are a lot of piezophiles, I’m unique because I have curves in all the right places.

Ready to meet,


Xenophyophore the piezophile – (Such an exotic name, right?)

Friday, November 2, 2018

Week 8 -- 02 Nov 2018

Week 8 Growth


The presence of five stratification layers are evident in the sediment of the control flask.  The bottom ~9.5cm appears to be just sediment, with no distinguishing characteristics, and likely has not developed into a stable community as of yet.  A thin, dark brownish-red band has appeared directly above that layer, occupying 1-2mm in places.  This layer is likely anaerobic and protected from the bulk of UV radiation.  Given its position, it is likely composed of sulfur bacteria.  A thick green layer sits atop that, occupying 2-2.4cm.  This community is likely composed of nonsulfur and cyanobacteria.  A thin darker green layer atop that, ~4mm, is likely a community of cyanobacteria, and the remainder of the column is occupied by 3cm of green water, likely containing diatoms and cyanobacteria.

Stratification in the 4% flask is less clearly distinguishable, though at approximately 10cm from the bottom an obvious dark green color change is apparent.  This developing community is likely within the photic and oxygenic range, and likely contains cyanobacteria and diatoms.

In the 8% flask, the majority of the sediment appears unremarkable.  A thin layer (~2mm) separates the sediment from the water layer above.  This layer appears dark, blackish green, likely containing any organisms capable of thriving in the saline environment.  A similar layer can possibly be observed at the top of the sediment in the 12% flask, though that corresponding layer is less than 1mm thick.  Turbidity in the water of the 12% flask is also notably lower than in the other flasks.
Figure 1 - Front view.  Left to Right: Control, 4%, 8%, 12%

Figure 2 - Top View.  Left to Right: Control, 4%, 8%, 12%

Figure 3 - Control

Figure 4 - 4% Salinity

Figure 5 8% Salinity

Figure 6 - 12% Salinity

Table 1 - Summary of Stratification in columns.
Darian Out.

Oscillatoria princeps dating profile- extra credit

                 Oscillatoria princeps     131                    📍  10 miles away