November 16th observations
Josie Wood
From my observations I found that there was more diversity in
stratification in the control and 4% salinity columns. From this, it is clear
that an increase in salinity can affect what organisms are able to grow. I also
found that that there was more stratified layers and colors on the side of the
column that is facing the window at all times (see table 1).
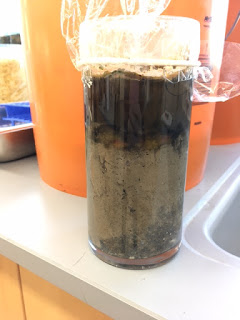
For the control column the bottom layer appears to just be sediment,
but the thickness of this layer differs depending on if it was on the light or
dark side (6.5 cm vs. 9.1 cm respectively). The dark red-brown band is most
likely anaerobic bacteria, however on the light side this band is thicker and
specked with light green, possibly anoxygenic photosynthetic bacteria. Darker
green bands on both dark and light sides are most likely communities of
cyanobacteria and nonsulfur bacteria. The green water most likely contains both
diatoms and cyanobacteria.
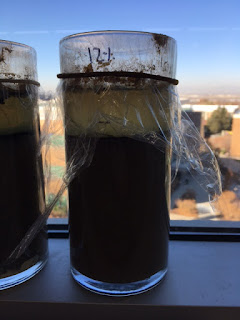
The 4% salinity column contains less stratification than
seen in the control column. Again, the sediment is occupying the bottom 9.2-9.7
cm of the column. The dark side of the column then has a 1.2 cm band of dark
green, most likely cyanobacteria, and then the water. The light side has a
yellow band with pink spots between the sediment and the green band of
cyanobacteria. This yellow/pink band may contain purple and nonsulfur photosynthetic
bacteria.
Both the 8% and 12% salinity columns had less stratification
and did not show any changes between the dark and light sides. For both these
columns the sediment occupies most of the space with a thin layer of dark
green/black at the top of the sediment and then the water. These observations
are similar to those that were made on week 8 although the green/black layer
seems to be slowly gaining thickness. Approximately .2 cm to .7 cm in 8%
salinity and from less than .1 cm to approximately .1 cm in the 12% salinity
column.
Figure 1. Control (left = dark side, right = light side)
Figure 2. 4% salinity (left = dark side, right = light side)
Figure 3. 8% salinity
Figure 4. 12% salinity
Figure 5. Top view (control on left with increasing salinity to the right)


No comments:
Post a Comment